
Gauge R&R: How to Run and Read the Study
Gauge R&R (gauge repeatability and reproducibility) measures how much of the variation you see in measurement results comes from the measurement system itself rather than from the parts. If a caliper, CMM program or inspector contributes too much variation, good parts may be rejected and bad parts accepted. For molded and machined parts with tight tolerances, a gauge R&R study tells you whether your inspection data can be trusted.
Many measurement disputes between suppliers and customers are really measurement system problems. For example, two inspectors measuring the same bore with the same bore gauge may report results 8 µm apart, which is a large share of a 21 µm H7 tolerance. In this guide, we explain gauge R&R: what it measures, how to run a study, how to read the results, acceptance criteria, common causes of poor results and how to improve them. For capability analysis, see our guide to process capability Cpk.
Gauge R&R quantifies measurement system variation as repeatability (equipment variation: the same operator measuring the same part repeatedly) and reproducibility (appraiser variation: different operators measuring the same parts). A typical crossed study uses about 10 parts, 2–3 operators and 2–3 trials each, analyzed by the average-and-range or ANOVA method. Results are expressed as %GRR of tolerance or of total variation and as the number of distinct categories (ndc). Common guidance (AIAG MSA): below 10% is acceptable, 10–30% may be acceptable depending on application, above 30% is unacceptable, with ndc of at least 5.
In short: gauge R&R checks whether your measurements are precise enough for the tolerance you are checking.
Key points:
- Repeatability: equipment variation.
- Reproducibility: operator variation.
- Criteria: under 10% good, over 30% unacceptable.
What Is Gauge R&R?
Gauge R&R is a statistical study of how much a measurement system varies when measuring the same parts.
Two components:
- Repeatability (EV): variation when one operator measures the same part several times with the same gauge
- Reproducibility (AV): variation between operators measuring the same parts
For example, if one inspector gets 10.012, 10.015 and 10.011 mm on the same pin, repeatability is the spread of those values. Measurement system analysis is part of quality planning; statistical methods are described in standards from ISO, such as ISO 22514.
Key Takeaway: Above all, gauge R&R measures the measurement, not the part.
Why Does Gauge R&R Matter for Precision Parts?
Gauge R&R matters for precision parts because measurement error takes a share of the tolerance.
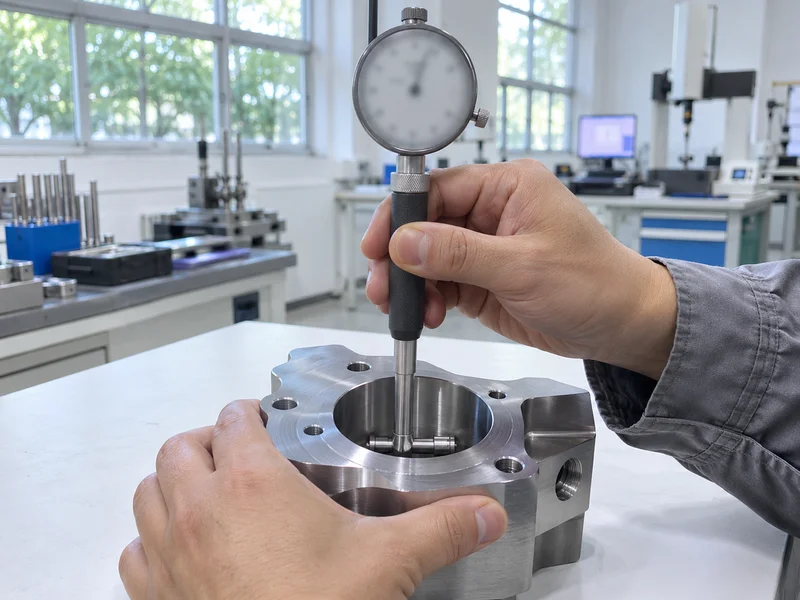
Effects of poor gauge R&R:
- Good parts rejected when measurement noise pushes them out
- Bad parts accepted when noise pushes them in
- Misleading SPC charts and capability studies
- Supplier-customer disputes over different results
For example, a gauge with 40% GRR on a ±0.01 mm feature makes the result almost meaningless. Our guide to tight tolerance machining explains measurement needs.
Key Takeaway: In other words, the tighter the tolerance, the more gauge R&R matters.
How Do You Run a Gauge R&R Study?
You run a gauge R&R study with a defined set of parts, operators and repeated measurements.
Typical crossed study:
- Select about 10 parts covering the process range.
- Choose 2–3 operators who normally measure the part.
- Number parts but hide numbers from operators if possible.
- Each operator measures each part 2–3 times in random order.
- Record results and analyze with average-and-range or ANOVA.
- Calculate %GRR and ndc.
For example, 10 parts × 3 operators × 3 trials gives 90 measurements, enough for a standard study. Our guide to CMM measurement explains CMM-based measurement.
Key Takeaway: For this reason, use real production parts that span the expected variation.
How Should Study Results Be Read?
Gauge R&R results should be read through %GRR and the number of distinct categories.
| %GRR (of tolerance or total variation) | Typical judgment (AIAG MSA guidance) |
|---|---|
| Below 10% | Acceptable |
| 10–30% | May be acceptable, depending on application and cost |
| Above 30% | Unacceptable; improve the system |
Additional indicators:
- ndc (number of distinct categories): at least 5 recommended
- EV vs AV: shows whether the gauge or the operators dominate
For example, high AV with low EV suggests operators measure differently, pointing to training or fixture issues. Our guide to the control plan shows where gauges are used.
Key Takeaway: Overall, look at both %GRR and which component dominates.
What Causes Poor Gauge R&R?
Poor gauge R&R is caused by the gauge, the method, the operators or the parts.
Common causes:
- Insufficient gauge resolution for the tolerance
- Worn or uncalibrated gauges
- Unclear measuring location on the part
- Different operator techniques
- Temperature variation
- Part form errors (for example ovality affecting diameter readings)
- Unstable fixturing
For example, measuring a plastic part diameter with a caliper at random positions gives poor results if the part is slightly oval. Defining the location and using a fixture improves it. Our guide to machining tolerance chart explains matching gauges to tolerances.
Key Takeaway: Equally, define where and how to measure before blaming the gauge.
How Do You Improve a Measurement System?
You improve gauge R&R by fixing the dominant source of variation.
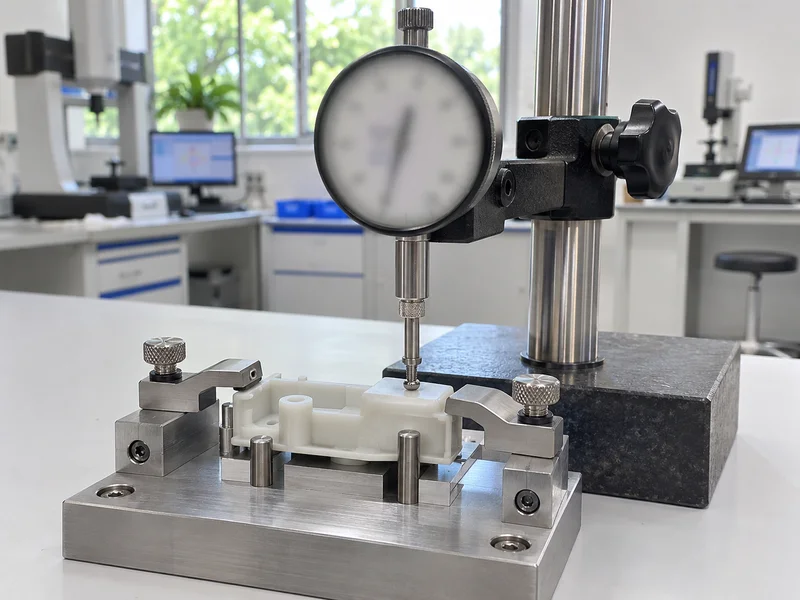
If repeatability (EV) dominates:
- Use a gauge with better resolution
- Maintain and calibrate the gauge
- Add fixtures for stable positioning
- Control temperature
If reproducibility (AV) dominates:
- Standardize the method with written instructions and photos
- Train operators
- Use fixtures to remove technique differences
- Automate measurement where practical
For example, switching from a handheld caliper to a fixture-mounted indicator can cut %GRR dramatically. Our quality control and inspection process uses calibrated gauges and defined methods.
Key Takeaway: As a rule, fix the biggest component first.
When Should Customers Ask for Gauge R&R?
Customers should ask for gauge R&R when tolerances are tight, features are critical or results disagree.
Typical cases:
- Critical-to-quality (CTQ) features
- New gauges or CMM programs
- PPAP or similar submissions
- Disputes between supplier and customer measurements
- Capability studies that rely on the measurement data
For example, before accepting Cpk data on a critical bore, a customer may request a gauge R&R on the bore gauge used. Our guide to PPAP levels explains when MSA is submitted. MSA studies are supplied on request for agreed features.
Key Takeaway: Finally, ask for gauge R&R on the features that matter most.
FAQ
- Q: What is gauge R&R?
- A study of measurement variation from repeatability (equipment) and reproducibility (operators).
- Q: What is an acceptable gauge R&R?
- Below 10% is generally acceptable; above 30% is unacceptable.
- Q: How many parts are used in a gauge R&R?
- Typically about 10 parts, 2–3 operators and 2–3 trials.
- Q: What is ndc?
- Number of distinct categories; at least 5 is recommended.
- Q: How can gauge R&R be improved?
- Better gauges and fixtures for repeatability; standard methods and training for reproducibility.
Conclusion
Gauge R&R shows whether measurement results can be trusted for the tolerance being checked. Run a structured study, read %GRR and ndc, fix the dominant source and apply it to critical features first. To discuss inspection for your part, send your 3D model and 2D drawing to our engineers.